By: Marianne Hark (Evaluator)
Your coalition or organization has been doing the work. You’ve convened subcommittees, launched media campaigns, shifted local policies, secured new funding, and brought sectors to the table. You’ve logged every service, community change, and resource generated into REACH. But when it’s time to step back and make sense of it all, what do you actually see?
REACH has always been about more than recording and reporting. Entering accomplishments tied to your logic model, strategies, and funding sources creates a record that tells a real story. Semi-annual and annual reports help tell that story but are limited snapshots of specific time periods. The new Dashboard is designed to change that. It pulls directly from the data you are already entering and turns it into visualizations you can use at any time, whether in leadership meetings, strategic planning sessions, funder reports, or your own internal conversations about where to focus next.
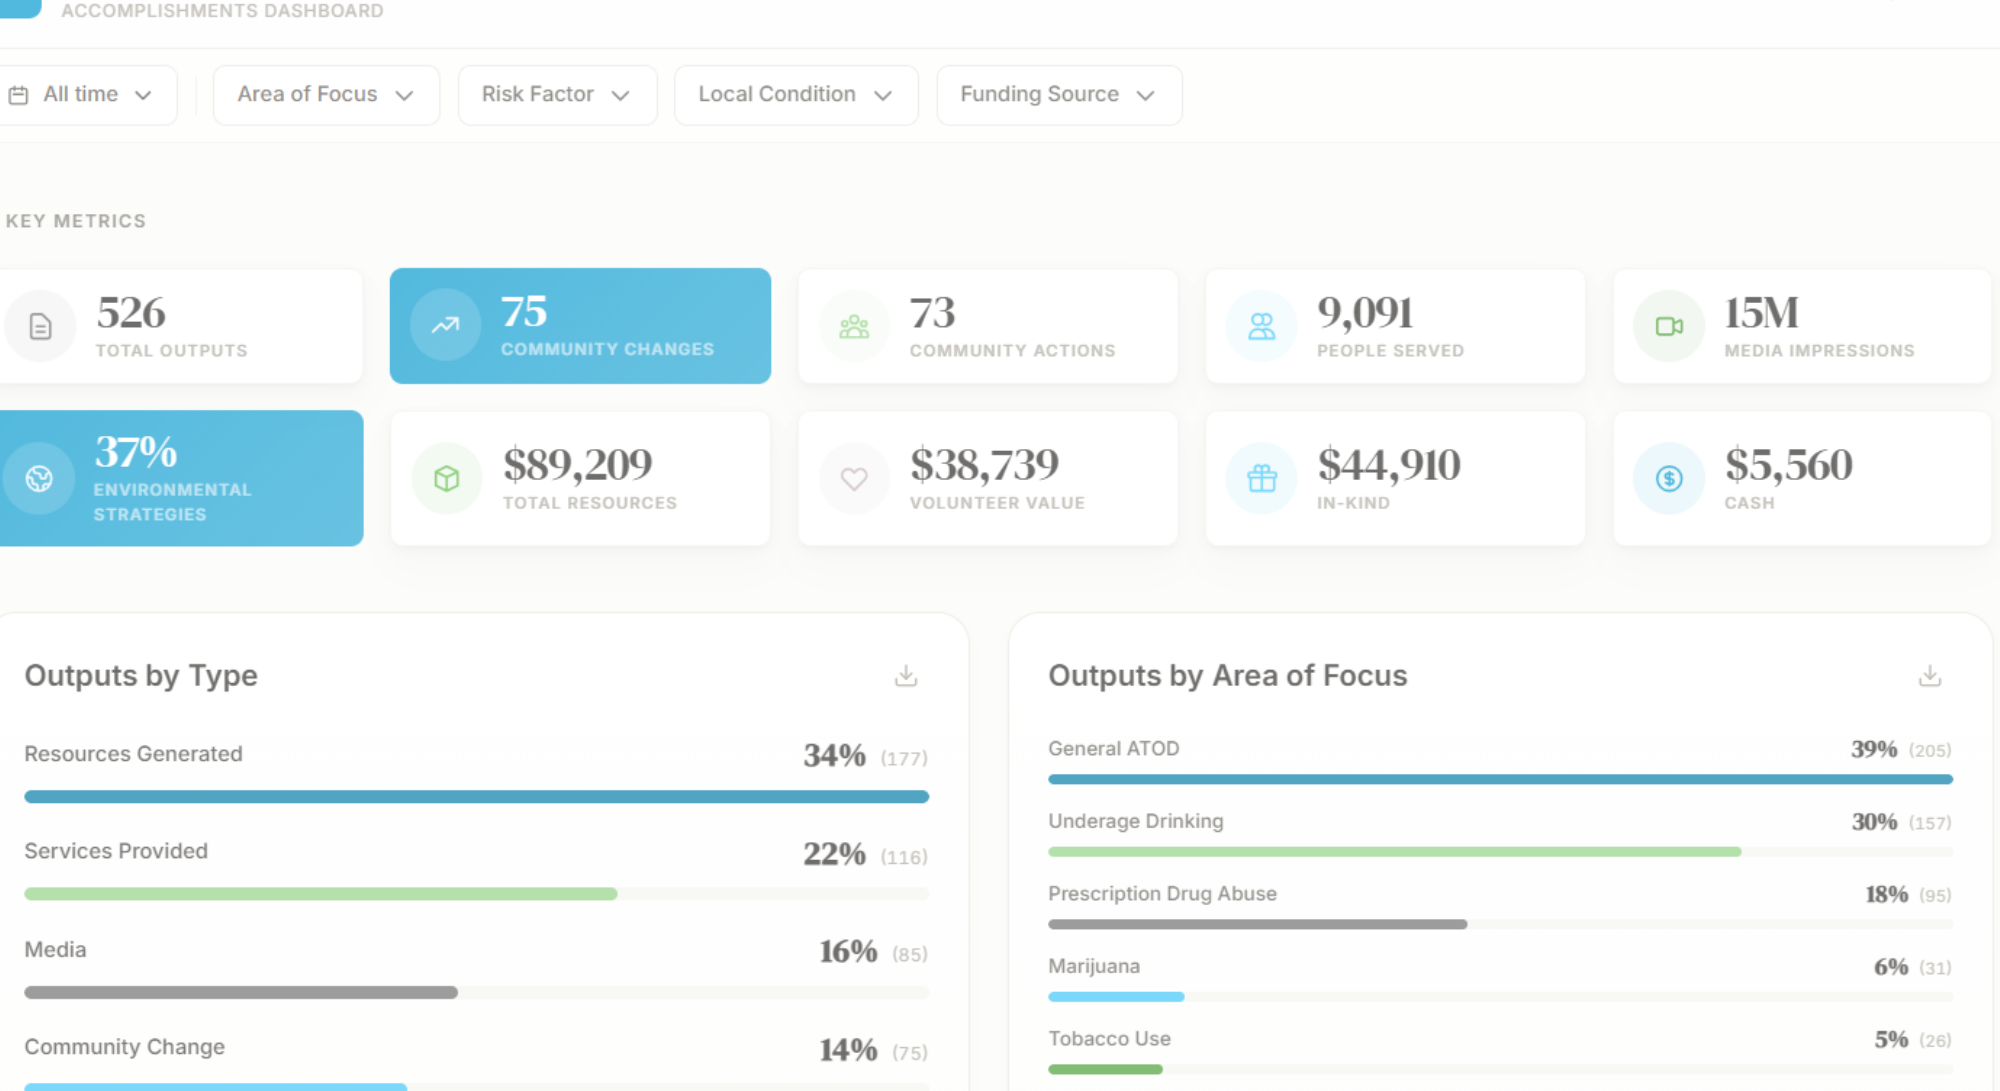
When you open your Dashboard, Key Metrics put your coalition’s full body of work in one place, including total outputs, environmental strategies, community changes, numbers served, media impressions, and resources. At a glance, you can see whether your activity this year (or month or quarter) looks like you expected and if it doesn’t, the rest of the dashboard can help you figure out why.
Under key metrics, Charts break down your work by output type, problem, risk factor, local condition, strategy, sector involvement, and funding source. Some coalitions find their distribution is more skewed than expected. If your accomplishments are clustering around one part of your logic model and another area is consistently thin, that’s worth knowing. When you look at outputs by strategy, you might find that your coalition is consistently executing on one or two of the seven strategies while others barely appear. Is that intentional? Does it match what your work plan says you’re trying to do? While the dashboard won’t answer these questions for you, it gives you the picture needed to have the conversation and be deliberate with your time, effort, and resources.
The Trends section lets you track your outputs, media reach, people served, resources generated, and community changes/actions over time. Choose three, five, seven, ten or all years to view your progress. Trend data add layers and depth to the story. If your outputs peaked in 2023 and have been declining since, that pattern deserves attention. If your media reach spiked in a particular year, what drove it? When you’re planning next year’s work, trend data are your best reality check. They show what’s actually been growing, what’s been shrinking, and whether the patterns match intention. It’s also easy to lose sight of how far you’ve come when you’re deep in the day-to-day. Pulling up five or ten years of accomplishments is a good reminder that the work is adding up.
If you want to see how you’re doing in a specific area or time frame, the dashboard lets you easily Filter your data to drill down on individual elements. Need to pull together a quarterly check-in? Filter by date. Reviewing progress on a particular risk factor at your next coalition meeting? Filter by your logic model element and walk through the data together. Do you have a funder report due? Filter the entire dashboard to that funding source and see exactly what their investment supported.
Coalition communications look better when they feel consistent, and the Dashboard supports that. Logos and chart colors will match your organization’s brand, and you can save images of any chart directly for use in reports, presentations, newsletters, or social media. If you’d like your coalition leaders or other members to easily see your dashboard without logging in, let us know, and we’ll make it public for anyone with the link.
We didn’t build the new Dashboard to add something new to your plate. We want our clients to own their data, see it clearly, and know how to use it. If you’re a current REACH user, look for information on accessing your dashboard in the coming weeks. We’ll have walkthroughs and resources to help you get started. And as always, we want to hear what you think, what’s working, what’s missing, and what questions you’re hoping your data can help you answer.
For access to your organization’s new Dashboard today, use the link here to submit your information.